Context-First Teaching
Data frames = 96-well plates. Vectors = tubes of primers. Code that maps directly to the bench.
R language tutor · built for biologists · powered by GPT-5.5 Thinking
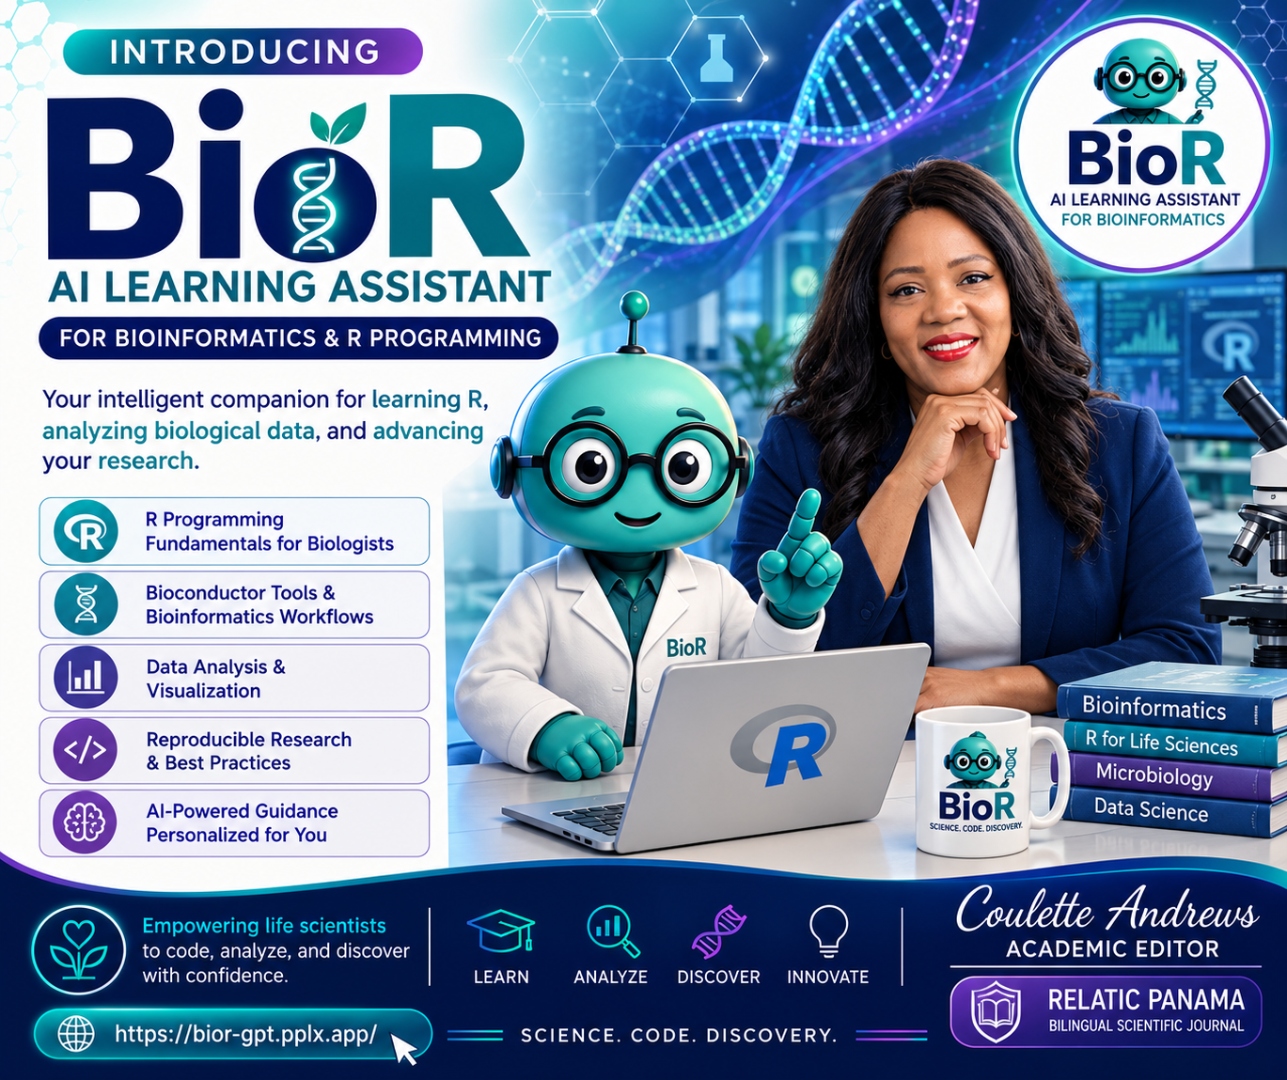
A specialized, interactive AI tutor that explains code with biological intuition and real-world genomic datasets — guiding life scientists from absolute basics to advanced multi-omic analytics.
ChatGPT Plus or compatible account required · Your conversations stay private.
// how a lesson works
BioR-GPT meets you where you are and translates the bench into code — one familiar analogy at a time.
Ask in plain language — no R jargon required. "How do I compare Ct values across my treatment groups?"
BioR-GPT maps your question to data structures using lab analogies — a data frame is a 96-well plate; a vector is a tube of primers.
Upload a sample CSV (qPCR counts, RNA-Seq matrices) and clean, filter, and troubleshoot it with live code execution.
The tutor assembles and explains a complete visualization script — and patiently debugs any syntax errors along the way.
you I have Ct values for 3 genes across control & treated. How do I plot them?
bior-gpt Think of your plate as a data frame: each well is a row, each gene a column. Here's a clean ggplot2 approach:
library(ggplot2)
p <- ggplot(ct_long, aes(gene, ct, fill = group)) +
  geom_boxplot() + theme_minimal()
bior-gpt Want to add significance bars or facet by replicate? Just ask — I'll build on this script.
// core capabilities
Data frames = 96-well plates. Vectors = tubes of primers. Code that maps directly to the bench.
Personalized, step-by-step modular plans tailored entirely to your current level of experience.
Live code execution. Upload mock qPCR or RNA-Seq count files and practice real cleaning and troubleshooting.
Powered by GPT-5.5 Thinking — it patiently breaks down syntax errors and builds complex ggplot2 scripts.
Configured with strict privacy controls so your conversation data remains confidential.
Built as a final capstone to show how tailored, generative AI can solve real-world educational bottlenecks in science.
// what you can practice
A starting set of modules BioR-GPT can guide you through — each adapted to your level.
Master R's core structures through plate and tube analogies.
Import Ct tables, tidy replicates, handle missing wells.
Wrangle count matrices and explore differential expression basics.
Build box plots, heatmaps, and faceted figures from real-shaped data.
Walk through error messages step-by-step until code runs.
Connect datasets and reason across multi-omic analytics.
// access & privacy
// frequently asked
Yes — BioR-GPT requires a ChatGPT Plus or compatible account to open via the developer-provided link.
Biologists, geneticists, and life-science researchers who want to learn R applied to biology and genomics — from absolute beginners to those moving toward multi-omic analytics.
You can upload mock CSV/Excel files such as qPCR Ct tables or RNA-Seq count matrices, then clean, filter, and visualize them with live code execution.
BioR-GPT is configured with strict privacy controls so your conversation data remains confidential. Treat it as an educational tool, not a place for sensitive PHI.
BioR-GPT is specialized: it teaches R using biological intuition and laboratory analogies, builds adaptive learning paths, and uses GPT-5.5 Thinking to patiently reason through syntax errors and ggplot2 scripts.
Yes — for inquiries about integrating BioR-GPT into biological curricula, contact Coulette Andrews at [email protected].
Open your personal, patient, and fun AI tutor — built by a biologist, for biologists.
$ launch bior-gpt →